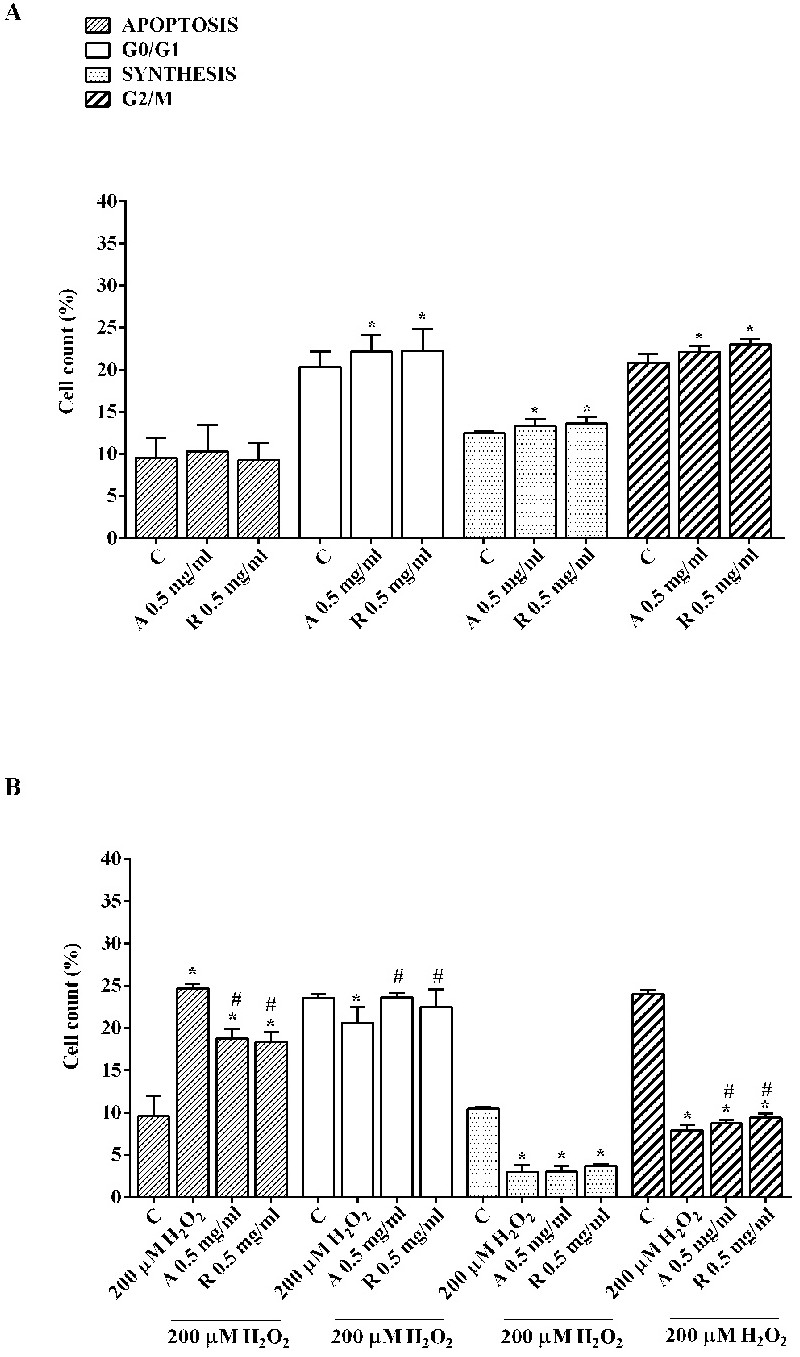
Fig. 8. Effects of HUVEC/RPE cells co-culture on RPE cell cycle progression, in physiological (A) and peroxidative (B) conditions. Cell cycle distribution was measured by flow cytometry using propidium iodide stain and quantitative analysis of apoptosis, G0/G1, synthesis, and G2/M phase is shown in a bar graph form. Abbreviations are as in previous Fig.s. Reported data are means ± SD of five independent experiments for each experimental protocol. Significance between groups: *P<0.05 vs C; #P<0.05 vs 200 μM H2O2. Short square brackets indicate significance between groups (P<0.05).